Digital Eye Strain Statistics 2024-2025
Digital eye strain isn't rare—it's routine. Around two-thirds of screen users report symptoms like dryness, headaches, and blurred vision. Latest research from 103 studies across 20 countries reveals the true scale.
Key Statistics at a Glance
Global prevalence
Meta-analysis of 103 studies
US economic impact (2023)
AOA/Deloitte report
Prevalence during pandemic
Up from 5-65% pre-COVID
Global Prevalence
Meta-Analysis Findings
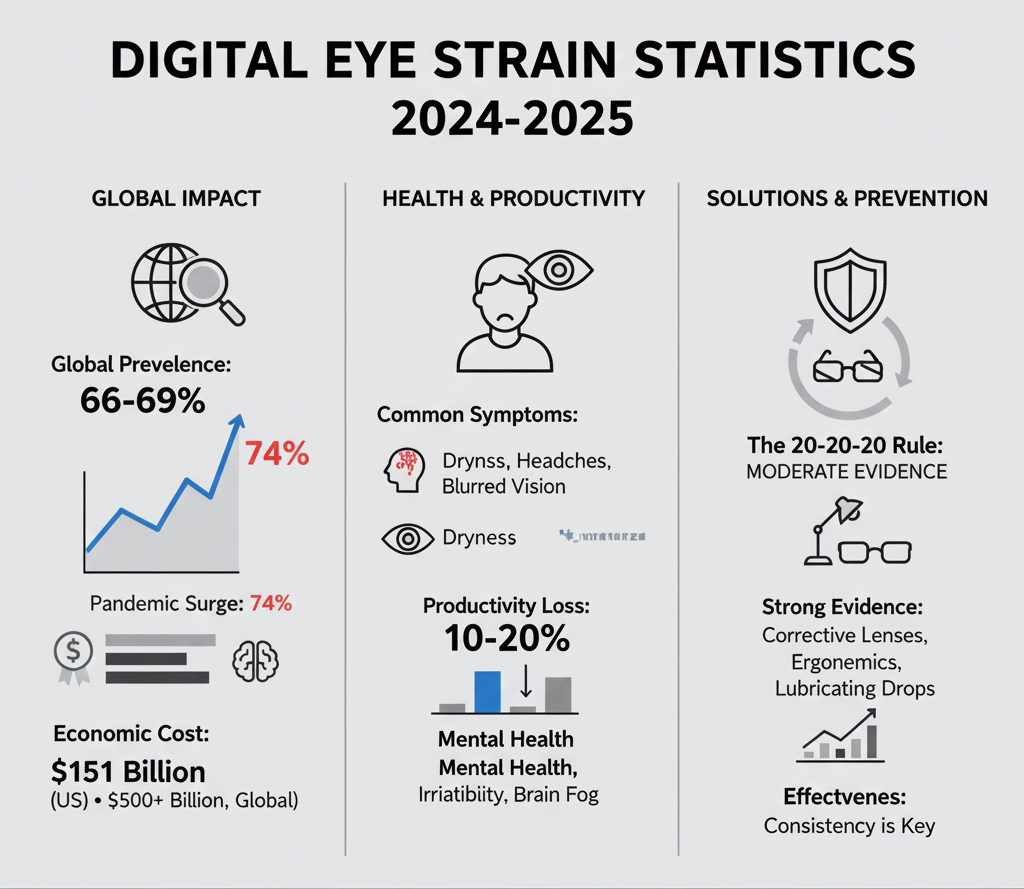
A comprehensive 2024 systematic review of 103 cross-sectional studies across 20 countries with 66,577 participants established a pooled prevalence of 66%.
A 2023 meta-analysis updated global prevalence to 69%. Prevalence ranges from 8.2% to 100% depending on population studied and methodology.
United States Prevalence
Adults report DES symptoms
Working-age Americans with 7+ hrs screen time
Office workers with excessive screen time
Computer users with visual symptoms (AOA)
CooperVision Study (2023, N=750, ages 18-44)
- • 69% experience symptoms associated with digital eye strain
- • 38% experience symptoms multiple times per week or more
- • 52% spend 6+ hours daily on digital devices
- • 25% spend 9+ hours daily on screens
COVID-19 Pandemic Impact
The pandemic served as an inflection point for digital eye strain, nearly tripling prevalence rates that remain elevated today.
Before, During, and After
| Period | Prevalence | Notes |
|---|---|---|
| Pre-pandemic | 5-65% | Variable across studies |
| During pandemic | 74% | 2024 systematic review |
| Post-pandemic (2022) | 63.7% | vs 24.7% pre-pandemic |
| Children (pandemic) | 50-60% | Significant increase |
Screen Time Changes
- •61.7% of workers added 1+ hour of screen time since pandemic
- •Research publication surge: 395 articles (1973-2019) vs 544 articles (2020-2023) - 38% increase in 3.5 years
- •Remote work screen time consistently higher than hybrid arrangements
Economic Costs: United States
AOA/Deloitte Economics Institute Report (January 2024)
Total costs of unmanaged excessive screen time in 2023 reached $151 billion
Direct health & productivity
Symptoms & productivity
Wellbeing costs
Breakdown of Direct Costs ($51.8 billion)
Productivity Losses: $50.6 billion
Healthcare System Costs: $1.2 billion
Per Person Annual Costs
Symptoms related to excessive screen time per person
Cost per male exposed to excessive screen time
Cost per female exposed to excessive screen time
Average productivity loss per person
Global Economic Impact
The World Health Organization estimates £411 billion ($500+ billion) in global productivity losses from undiagnosed and untreated vision problems annually.
Potential Savings from Intervention
If those with unmanaged screen time visited optometrists yearly, potential annual savings could reach:
- • $61.1 billion total potential savings
- • $1,920 per person in individual savings
- • $45.5 billion in potential productivity gains
- • $26.3 billion in wellbeing improvements
Workplace Productivity Impact
University of Alabama Birmingham Study
- • Computer users with small refractive errors show 20% performance decrease on specific tasks
- • 10% productivity improvement possible with proper computer eyewear
- • Providing computer vision care to all employees yields significant cost-benefit ratio
Workplace Effects Statistics
Workers have at least one eye issue
Report negative productivity impacts
Experience reduced ability to focus
Report mental health impacts
Symptoms affect work performance
Productivity loss from unmanaged strain
Health Impacts and Symptoms
👁️Ocular Symptoms (89.5%)
- 1. Eye dryness (most prevalent)
- 2. Headache
- 3. Eye redness
- 4. Eye strain/soreness
- 5. Eye itching
- 6. Blurred vision
- 7. Burning sensation
- 8. Eye irritation
- 9. Photophobia (light sensitivity)
- 10. Tearing/watery eyes
🦴Musculoskeletal (94.3%)
- Neck pain79.1%
- Back pain82.7%
- Shoulder pain69.8%
Productivity and Quality of Life Impact
Symptoms affect ability to complete tasks
DES reduces attention/concentration
Migraines/chronic headaches worsen
Report daytime sleepiness
Report difficulty with sleep entry
Remote Work Effects
VSP Vision Care & Workplace Intelligence Study (2024, N=1,600)
Remote/hybrid workers
7+ hours
daily screen time
On-site employees
5.5 hours
daily screen time
27% increase in screen time for remote workers
Health Impact by Work Setting
Remote workers report worsening eye health
Companies report increased screen fatigue
Professionals struggle with DES symptoms
Workers juggle multiple screens in meetings
Remote workers struggle to take breaks
US workers work remotely (28% hybrid, 12% full)
Prevention Methods Effectiveness
❌Blue Light Filters: LIMITED EVIDENCE
2023 Cochrane Systematic Review (17 randomized controlled trials, 6 countries):
- • No significant short-term advantage in reducing visual fatigue
- • No clinically meaningful difference in critical flicker-fusion frequency
- • Probably little to no effect on visual performance
- • Sleep quality results inconclusive
- • Blue light filters block only 10-25% of blue light
- • Screen blue light represents less than 1% of sun exposure amount
⚠️20-20-20 Rule: MODERATE EVIDENCE
Research shows mixed results (see Article 1 for full details):
- • Only 34% practice the rule (38 regularly, 109 occasionally)
- • Talens-Estarelles (2023): Effective for reducing DES symptoms (p≤0.045), but benefits disappeared after discontinuation
- • Johnson & Rosenfield (2023): No significant effect on symptoms (p=0.70)
- • Expert consensus: Any break from computer work is beneficial
✅Computer Glasses/Vision Correction: STRONG EVIDENCE
- • Correction of refractive error is an important intervention
- • Uncorrected astigmatism of 0.50-1.00D negatively impacts visual comfort
- • 1.00-2.00D astigmatic error may increase task errors by up to 370%
- • CooperVision Energys lenses: 82% experienced improvement in eye tiredness
- • 90% agreed on clear, reliable vision
Awareness Gap:
- • 50% never heard of contact lenses designed for DES
- • 71% unaware that glasses for DES existed
- • 58% never talked to eye care professional about device use
✅Ergonomic Interventions: WELL-SUPPORTED
Unmanaged Population Gap
Critical Gap
• 31.8 million (31%) with excessive screen time did not see optometrist in last 12 months
• 55% of this group experienced vision-related symptoms that could be improved
• 90% do not discuss device use with eye care practitioner
This represents significant public health and economic opportunity
Trends Over Time
Growing Prevalence
Screen Time Evolution
- • Average American worker: Now 7+ hours daily
- • 96 hours/week total screen time across all devices
- • 72% of Americans use digital devices 5+ hours daily
- • 62% increased smartphone usage past 2 years
- • 86.5% of children spend 2+ hours daily on digital devices
The Bottom Line
Digital eye strain isn't rare—it's routine. Around two-thirds of screen users report symptoms, and the shift to remote work pushed daily exposure even higher.
The cost is real: productivity dips, slower refocus, and end-of-day fatigue.
The good news? The most effective fixes are simple—structured breaks, distance viewing, deliberate blinking, solid ergonomics, and correct vision correction—and they work best when you actually do them consistently.
Vision Guard for macOS turns these best practices into a habit you'll keep
- ✓Pomodoro-based focus cycles
- ✓Gentle break overlay for real distance viewing (not phone scrolling)
- ✓Guided eye exercises
- ✓Smart auto-pause for calls/videos
- ✓Weekly stats that show what's working
Work smarter. Protect your vision. Feel better by 5 p.m.
Start your first protected focus block in under 60 seconds.